

In order to deliver on its mandate – the release of suitable land for the creation of sustainable human settlements – the HDA developed a geographic information system (GIS) tool called LaPsis (Land and Property Information System).
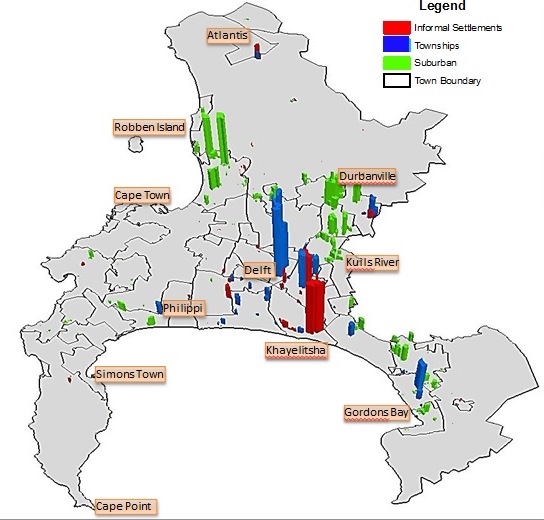
The science of geographic information systems (GIS) has a wide variety of applications that can be used to influence decision-making in the real world. The adjacent 3D map illustrates the footprint of residential growth between 2001 and 2013 in the City of Cape Town.
Residential growth in GIS has been monitored as follows:
The adjacent map illustrates that the footprint of residential growth in suburban areas expanded towards the urban edge of the city. Towns such as Milnerton, Durbanville, Brackenfell and Kuils River experienced the highest growth in the suburban footprint over the 13-year period.
Areas such as Delft, Blue Downs, Mitchells Plain and the Strand had the highest residential growth in the footprint of townships, whereas areas such as Khayelitsha, Blue Downs, Philippi and Kraaifontein had the highest residential growth in the footprint of informal settlements.
(Data source: GeoTerraImage)